
Resources
The Datanomy knowledge hub
Practitioner playbooks, client case studies and FAQs: everything we’ve published for teams like yours, in one place.
Featured


Free guide · Manufacturing finance
How FDs can take back control with data clarity
Why manufacturing finance loses control of its numbers and how leading FDs regain visibility, cut reporting time, and answer with confidence. A comprehensive guide written for finance, by finance.
- Why and where you start to lose trust in your numbers
- The four pillars of clarity to take back control
- The 1-10-100 rule of what an unchecked error really costs
Download PDFNo sign-up required
Custom Visuals
Custom visual · Datanomy Technologies
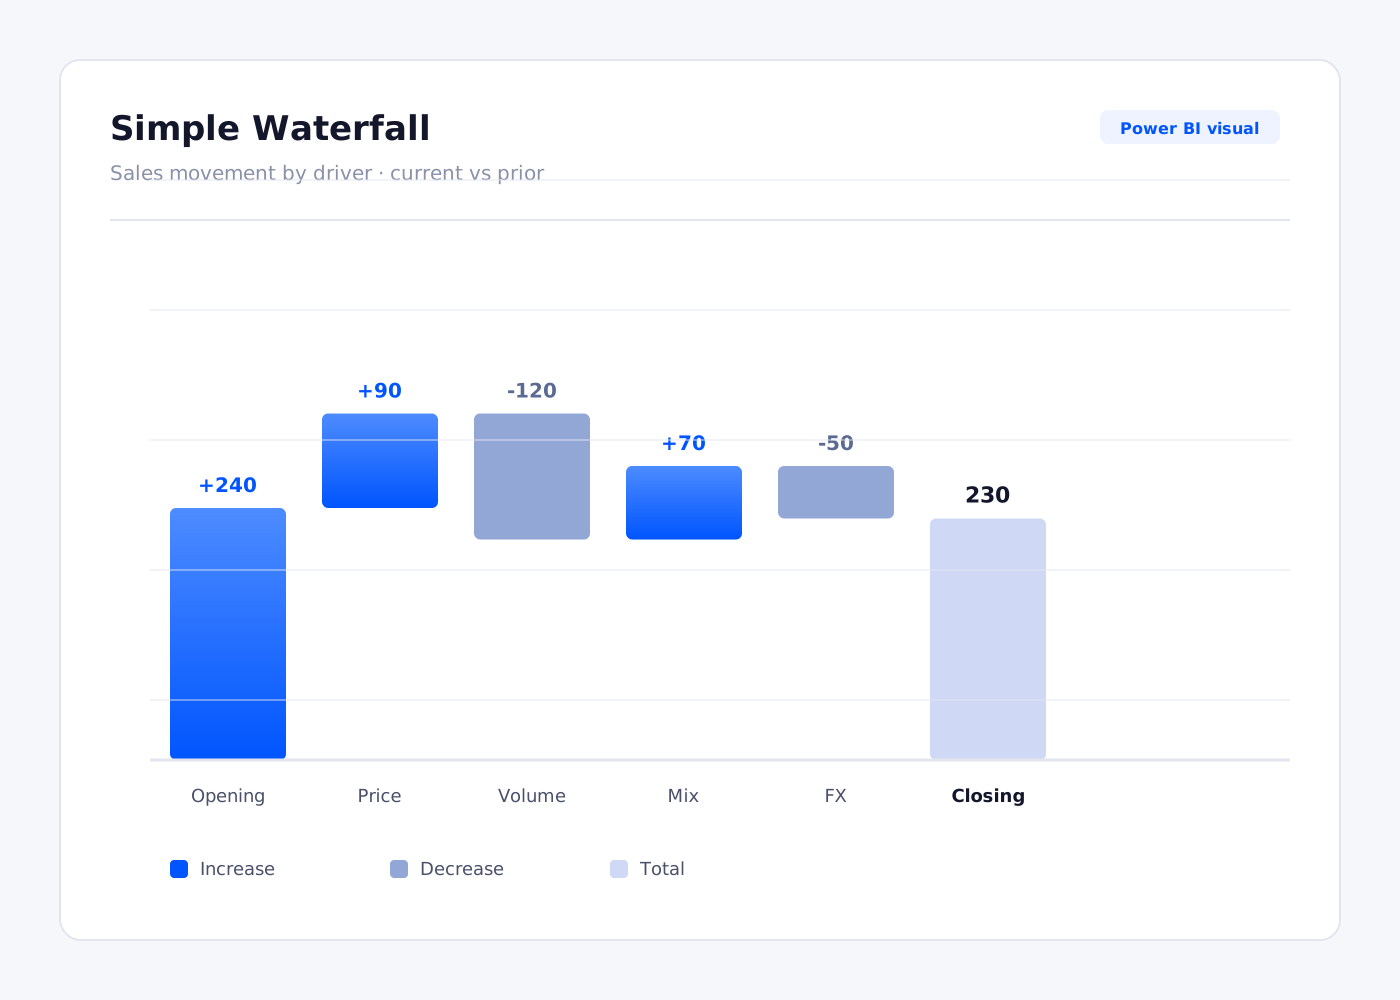
Simple Waterfall Chart
A clean, drop-in waterfall that shows how each driver builds to your bottom line, from opening balance through every increase and decrease to the close. Built to make variance and bridge analysis instantly readable for any finance audience.
Blogs
How to Spot If Your ERP Migration Has Left a Reporting Gap
How Excel Reporting Can Reduce Visibility in your Month-End
Are you Losing 100+ Hours/ Year to Manual Financial Processes?
How your Finance Team Can also Achieve A One-Day Month-End
How to reduce Excel dependency when you have ERP Reporting
Why do FDs struggle with Finance Reporting Confidence?
Simple Waterfall Chart: New version & Bug Fixes 2026
Top 10 Power BI Visuals (2026's best) With Use Cases & Pro Tips
7 Best Power BI Charts For Financial Reporting (and how to use them)
How Category Managers Use Waterfall Chart For Smarter Decisions
Data Visualisation Importance in Decision-Making (With Examples)
Simple Waterfall PBI Visual- All you need to know
Have any questions?
Let’s have a quick conversation about your current challenges, goals, and opportunities for improvement.
Book a free 15-minute call with us