
Home / Blogs / Simple Waterfall Chart: New Version & Bug Fixes 2026
Simple Waterfall Chart: New Version & Bug Fixes 2026

There’s always a Power BI visual that’s permanent in your dashboards, and finding a bug in it can really derail your reports. If that visual is Simple Waterfall by Datanomy Technologies, you’re in luck. This post covers a temporary workaround for the bugs you might be facing, the functionalities from the older version, and the improvements the latest version brings.
For a full introduction to the visual, see our companion post: Simple Waterfall PBI Visual — all you need to know.
How to fix errors: a temporary workaround
We keep the visual up to date on Microsoft AppSource and have updated Simple Waterfall to the latest Microsoft API for Power BI custom visuals. If you hit any bugs in the meantime, there are two workarounds:
- Option 1 — Organisational visual: add the visual to your organisational visuals.
- Option 2 — Power BI visual: import the visual directly into Power BI.
Importing the visual from your local computer
a. Enable developer options: in Power BI Desktop go to File > Options and Settings > Options, then under Report Settings tick “Develop a visual” and click OK.
b. Import the custom visual: download the temporary-fix zip from the Simple Waterfall GitHub repository, extract it, then follow Microsoft’s instructions to import a visual from a file.
c. Update the visual: once imported, switch the Simple Waterfall visual to another visual (e.g. a table), then click back on Simple Waterfall and it should start working. Right-click the visual icon to check the version — it should read 2.0.11.4.
Note: if you’d customised bar colours, importing the temporary fix may reset them — simply reapply your colours.
Functionalities in the older version
- Drill-through: click a data point to drill through to a more detailed report or page.
- Drill-down: click categories or aggregated points to view breakdowns.
- Visual interaction: click any pillar to filter the other visuals on the page.
- Filtering & slicing: basic filters (date, category, measure) and advanced filters (greater/less than, top N).
What’s new in the updated version
The new version keeps every previous feature and adds bug fixes, performance improvements and new options.
X-axis labels
Fixed distortion at the lowest drill level. “Fit to width” is now off by default; labels display vertically when space is tight, long labels can show as ellipses, and there are new concatenate and wrap-text options.
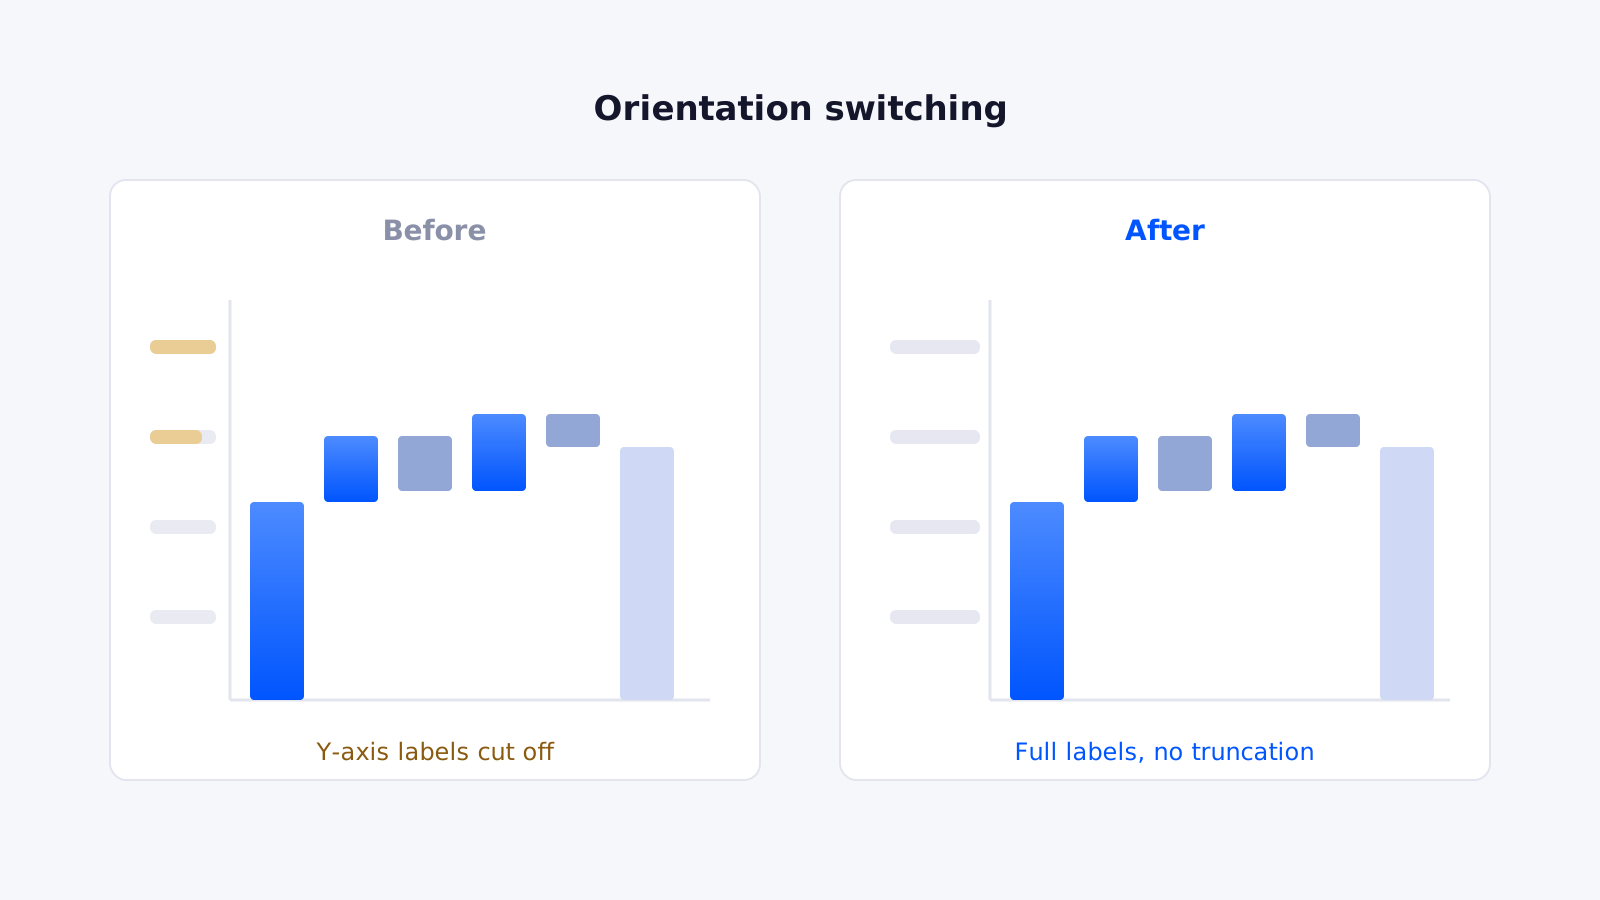
Orientation switching
Switching between vertical and horizontal no longer cuts off Y-axis numbers — labels display fully with no truncation.
Data format handling
Currency, decimals, percentages and scientific notation now display correctly and consistently. Labels follow the measure format when set to “None,” and apply no measure formatting when set to “Auto.”
Data label visibility & focus mode
Data labels now remain visible even in compact spaces, and the visual no longer goes blank when entering Focus Mode.
Number formatting
Values now respect formatting options including commas, parentheses for negatives and decimals — even when the label value format is set to “None.”
Calculation group compatibility
Formatting a calculation item now displays data according to the applied format, fixing a previous incompatibility.
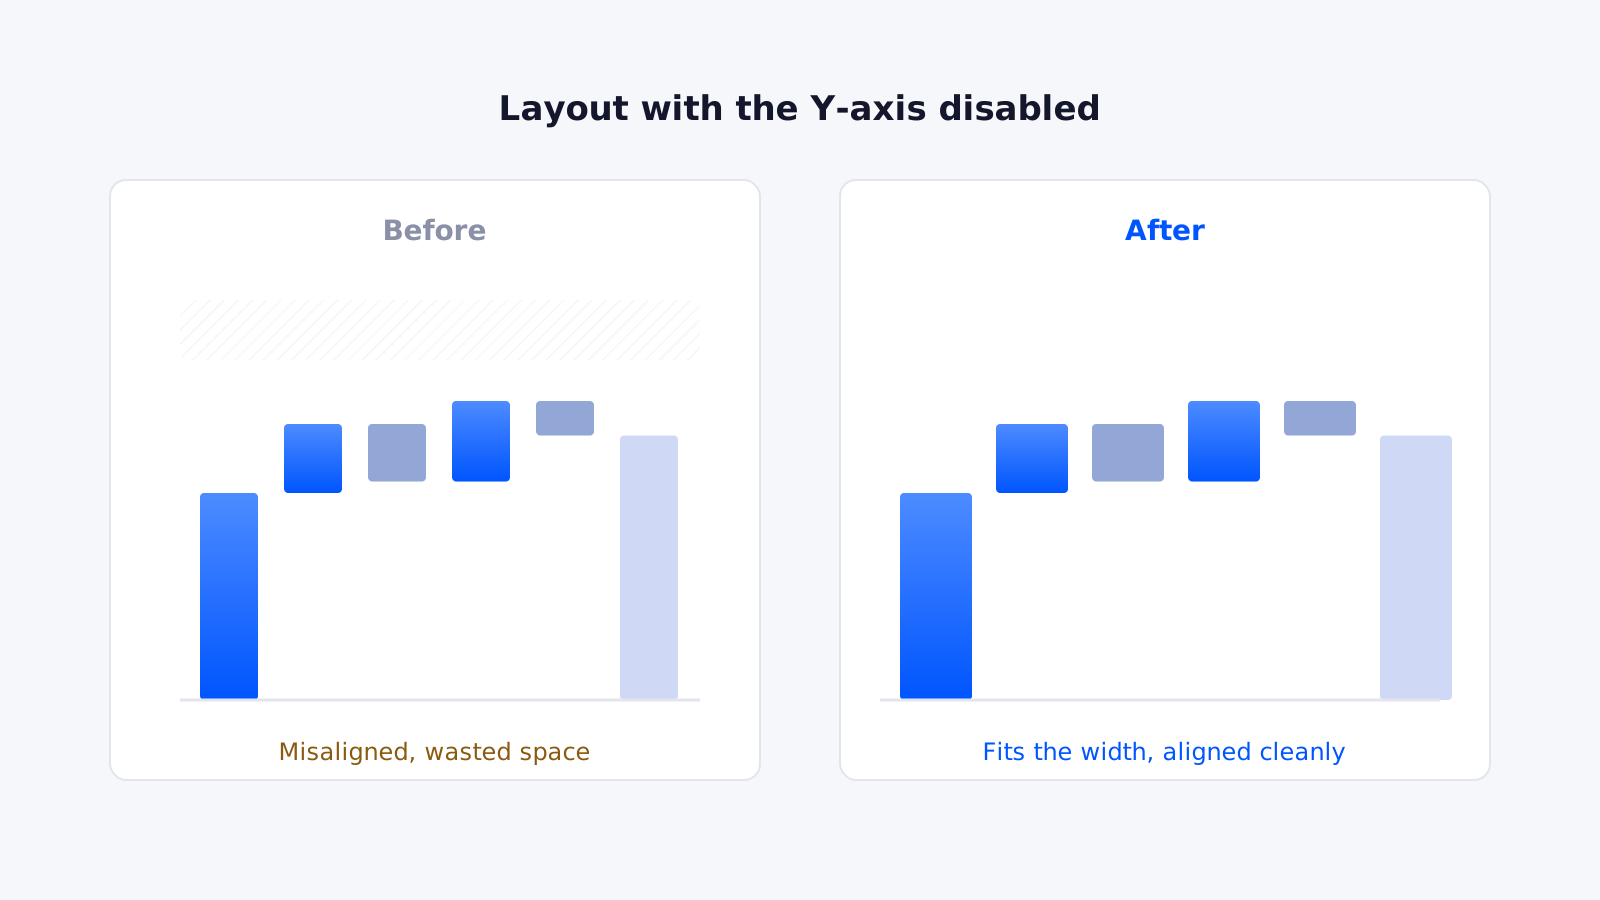
Y-axis behaviour
Disabling the Y-axis no longer leaves a large blank space or shifts the chart to the right; hidden Y-axis values now shift the chart left cleanly, keeping the layout aligned.
Horizontal orientation & decimals
“Fit to width” and “bar width” now work correctly in horizontal orientation, labels display properly on every bar, and the “auto” option for decimal places is back for automatic adjustment by data range.
Wrapping up
Bugs and upgrades are part of the tech journey. This temporary workaround can save the day, but the new version’s strengths are what will help you get the most out of the Simple Waterfall visual. If you hit any other issues — or just want to share feedback — get in touch; we’re always glad to hear from you.
Ready to trust your numbers again?
Book a free 30-minute call and we’ll talk through your current reporting and what’s possible.