
Home / Blogs / Simple Waterfall PBI Visual — All You Need to Know
Simple Waterfall PBI Visual — All You Need to Know

If you’re here, chances are you’ve come across Datanomy’s highly-rated Power BI Simple Waterfall chart. This guide walks you through the visual’s basics: overview, how to find the add-in, the types of waterfall chart, and general and visual formatting.
Overview
The Simple Waterfall chart is a tool for visualising how an initial value evolves through a series of positive and negative changes — the journey from point A to point B, with each intermediate step broken down. It categorises data into pillars (starting or ending points) and steps (incremental changes), so you can see exactly how the pieces add up or subtract down. It’s fully customisable: choose which data acts as pillars or steps, tweak colours for positive or negative changes, sort for clarity, and adjust labels and axes to fit your reporting style — making data-driven storytelling effortless.
How to find the add-in within Power BI
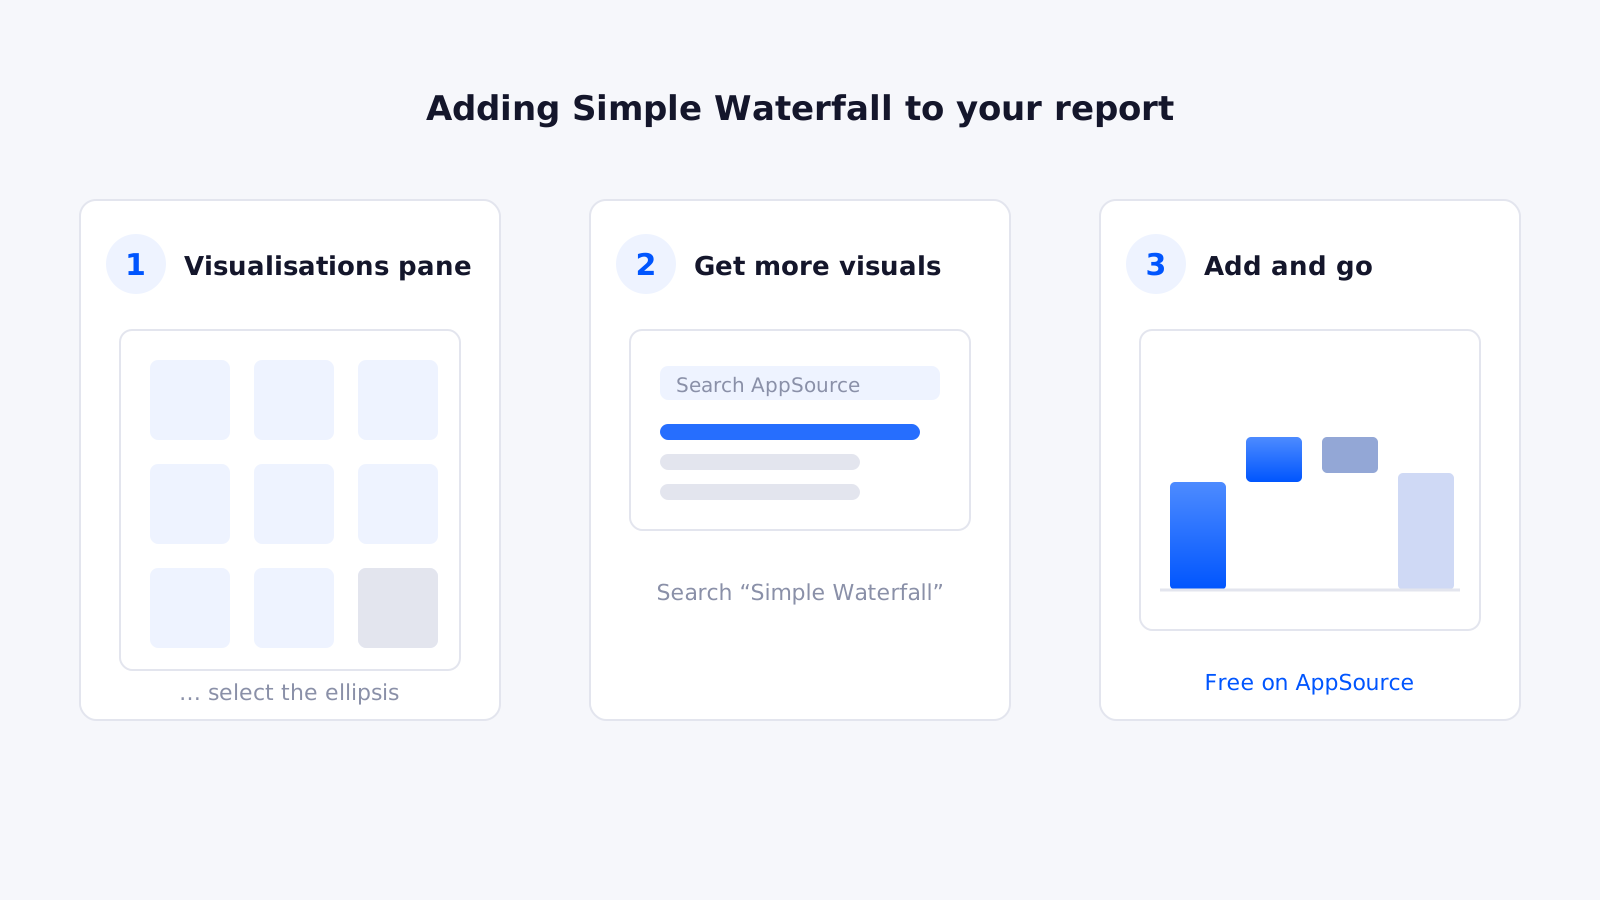
Step 1: select the ellipsis from the visualisations pane. Step 2: choose “Get more visuals” to install the latest version from AppSource (search “Simple Waterfall”), or “Import from file” if you have a specific .pbiviz version. Step 3: the visual appears as a new icon in the visualisations pane — select it to add it to the report canvas.
Types of waterfall chart
- Static measures: uses only measures, no category field; pillars/steps defined manually by measure.
- Static category: uses one category and one measure; pillars/steps defined by category.
- Drillable category: 2–3 category fields plus a measure, with drill-down support.
- Drillable measures: calculates the difference between each column as a step and uses column totals as pillars, with drill-down (default: measures = pillars, categories = steps).
General formatting
Properties control size, position and padding. Title options cover text, heading level, font, text and background colour, alignment and wrapping — with an inside-title subtitle, a configurable divider and spacing controls. Effects add background, border and shadow. Header icons let you set border, background and icon colours and transparency. Tooltip options configure the hover behaviour.
Visual formatting
Chart options
Switch orientation between vertical and horizontal; format using sentiments (favourable green, adverse red, total blue, other) or assign custom colours; and sort data default, ascending or descending.
Define pillars
Toggle each measure on to designate it a pillar (a starting or ending value) or off to treat it as a step (an intermediate change between pillars).
Margins & bar colour
Adjust top, bottom, left and right margins. Bar colour follows the Sentiments toggle: when on, totals, favourable and adverse each get a distinct colour; when off, you define colours for each pillar and step individually.
Legend, X-axis and Y-axis
The legend shows sentiment categories (when Sentiments is on) with font size, colour and family controls. X-axis options cover font, fit-to-width, minimum bar width, text wrap, padding and gridlines. Y-axis options include the base starting point (auto or zero), show/hide values with format and decimals, gridlines, a zero line and the option to join bars with a connecting line.
Labels
Control label font size, family and positioning; use a default colour or set colours per label type (total, favourable, adverse, other); choose a value format (auto, thousands, millions, billions), hide zero/blank values and set decimal places. Note: with Value Format set to Auto it formats as expected and respects decimal places; set to None, label formatting follows the measure’s own format.
Conclusion
The Simple Waterfall chart is a must-have visual in Power BI for breaking down data and highlighting how values change step by step — whether you’re analysing financial trends, tracking performance or making sense of complex data. The key is to experiment with the formatting and customisation to tailor it to your needs. For the latest features and fixes, see Simple Waterfall: new version & bug fixes 2026, and reach out with any bugs or feedback.
Ready to trust your numbers again?
Book a free 30-minute call and we’ll talk through your current reporting and what’s possible.