Map the real close
We traced every export, handoff and reconciliation to see exactly where time and trust were lost.

Energy Finance Data automation
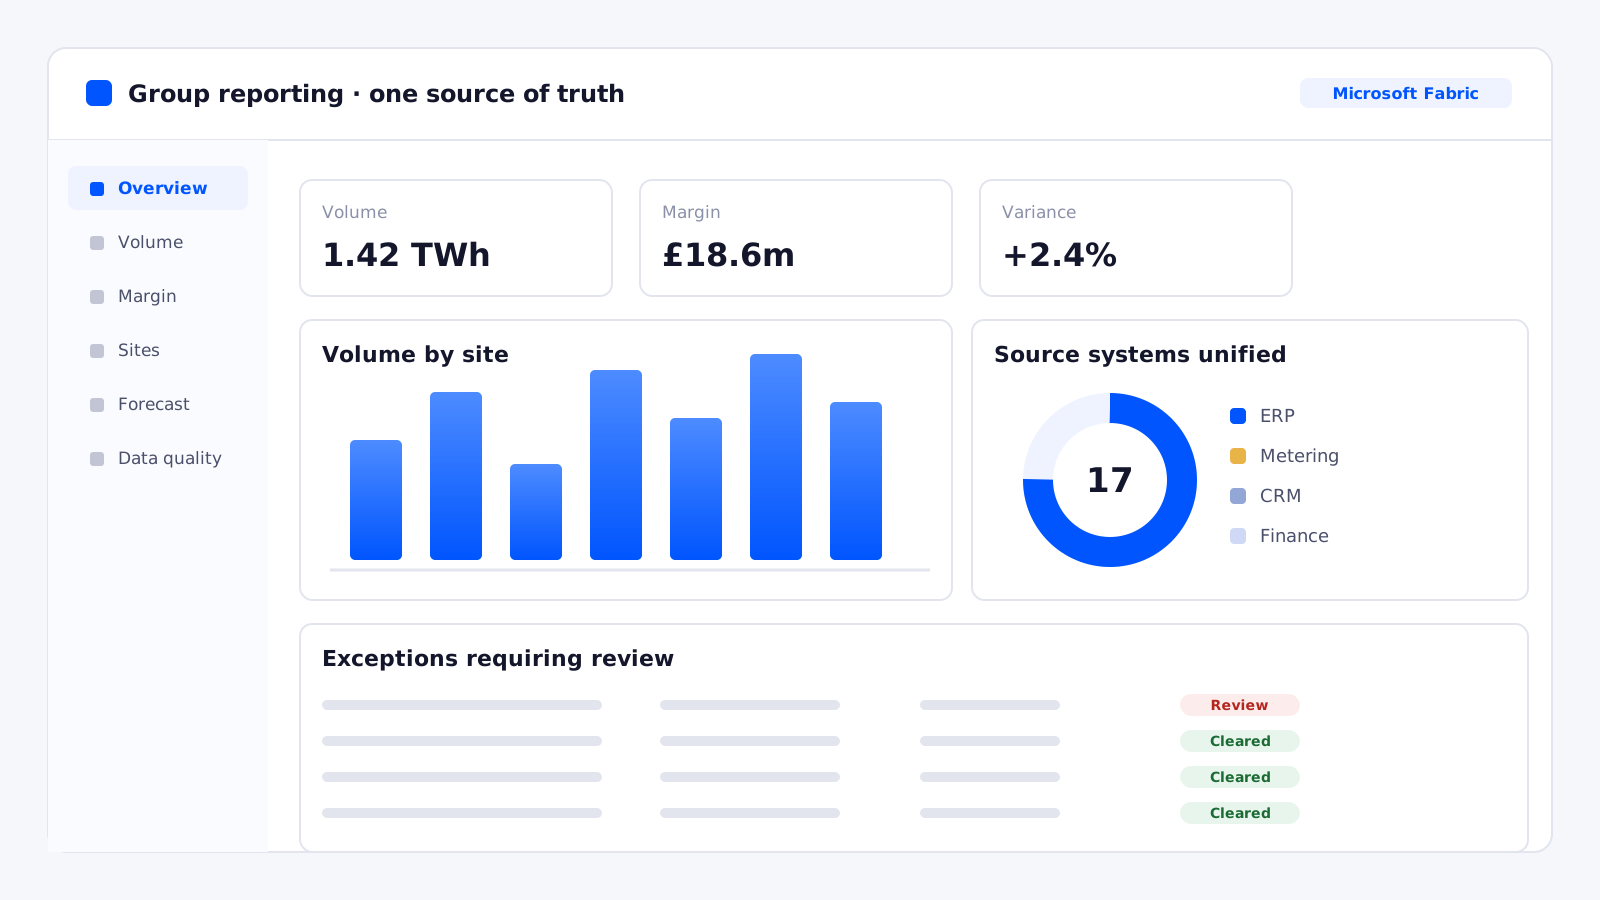
A leading energy supplier consolidated fragmented trading, billing and finance data into a single Microsoft Fabric semantic model, and gave the team a month-end they could finally trust.
 One source of truth
Measured against the position we started from, in the first year after go-live.
The challenge
Trading, billing and finance data lived in 17 disconnected systems. Every close began with the same ritual: export, reshape, reconcile and hope. By the time the numbers agreed, the month they described was already old news.
The team wasn’t short on talent, they were short on a single version of the truth. Senior analysts spent their first two weeks each month rebuilding the same workbooks instead of explaining what the numbers actually meant.
How we approached it
We delivered in two-week sprints, putting a working report in front of finance early rather than saving a big reveal for the end.
We traced every export, handoff and reconciliation to see exactly where time and trust were lost.
All 17 systems were brought into one governed Microsoft Fabric model with shared, agreed definitions.
Power Automate took over posting and reconciliation, so the close runs itself and leaves an audit trail.
Role-secured Power BI dashboards where every figure traces back to source, ready before the meeting.
What we built
A governed semantic layer feeds a live board pack that assembles itself each morning, with drill-down to the transaction behind every figure.
Shared definitions across trading, billing and finance so a number means the same thing everywhere.
Data lands and reconciles before 6am, so the team starts the day on current reality.
Every figure drills back to source, so boardroom questions are answered in the room.
The results
For the first time, we walk into the board meeting knowing every number will hold up. Finance spends its energy on the story now, not on rebuilding the spreadsheet.
If you recognise these challenges in your own numbers, let’s have a quick call. We’ll talk through what the solution could look like for your business and how to get clarity and confidence back in your data, with no slides and no sales pitch.
We use cookies
Some cookies are needed to make this site work. We would also like to set analytics and marketing cookies to understand how the site is used and to measure our LinkedIn campaigns — but only with your permission. Read our cookies policy.
Choose which cookies you are happy for us to use. You can change this at any time from the “Cookie settings” link in the footer. See our cookies policy for the full list.
Strictly necessary
Always activeRequired for the website to work — security, network management and remembering your cookie choices. These cannot be switched off.
Functional
Remember preferences such as display settings, and whether you have already responded to a survey or pop-up.
Performance and analytics
Help us understand which pages are visited and where visitors run into problems, so we can improve the site. Includes Google Analytics and Microsoft Clarity.
Marketing
Used by LinkedIn to measure campaign performance and show relevant advertising. Includes the LinkedIn Insight Tag.