Here’s what you can do with the demo:
- Go Deeper into the Data: Drilldown for traction-level clarity.
- Click to Filter: Click on any bar and the whole page will update based on your selection.
- Everything Reacts Instantly: Every click or selection changes the visuals immediately, so it’s easy to explore and understand the data.
The Questions This Dashboard Answers
- At a Glance: Instantly Identify Your Key Margin Drivers
Our dashboards consolidate your key financial and operational metrics, giving you an immediate, high-level understanding of business performance and profitability. - Deep Dive: Understand Performance by Entity, Customer, and Product
Dynamically break down performance by the key variables that matter to your business. Instantly see which customers, products, or industries are driving your success. - Pinpoint Regional Performance: See Hotspots and Opportunities Instantly
Our geographic visualisations allow you to quickly identify high-performing locations and pinpoint areas that may require attention, all in a simple, intuitive map view. - Uncover Root Causes: Visually Trace Performance Variances to Their Source
Move beyond static reports. Our interactive visuals allow you to dynamically analyse performance across multiple categories to understand the specific drivers behind any variance. - Taming Complexity: Automating POC & PIT Accounting
We develop a clear set of business rules to manage complex POC and PIT accounting. This is critical for manufacturing but often time-consuming and risky when performed manually. Our automated workflow brings clarity, consistency, and governance to the process. - Clear Revenue Recognition: Track Projects and Accruals with Confidence
Track the balance sheet impact of projects with ease. See new projects coming onboard, monitor progress through delivery milestones, and understand your accruals with up-to-date, automated reports. - Total Transparency: Drill Down from Summary to Source Transaction
Our reports provide complete traceability. With a single click, you can drill down from a high level summary to an individual customer or order, and even link directly into your source systems to view the underlying data.
Check out another free dashboard here: Portfolio Analyser
Tangible Outcomes you can expect
Having worked on 120+ impactful projects, Datanomy can help you:
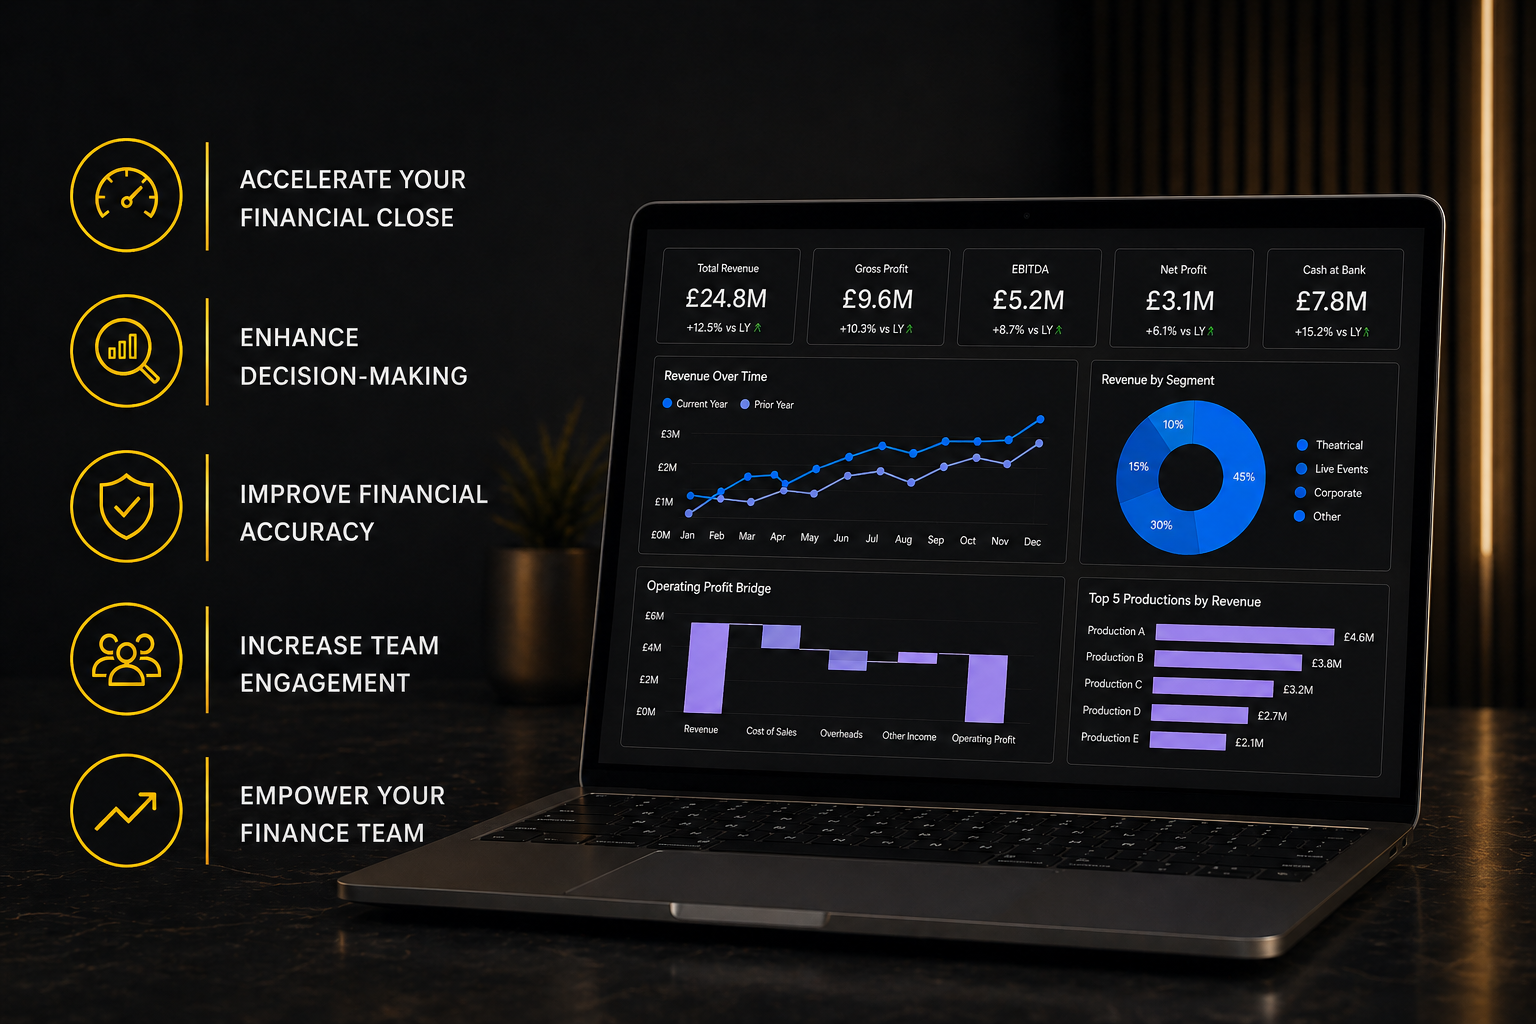
- Accelerate Your Financial Close: Massively reduce manual effort and time spent on reconciliation.
- Enhance Decision-Making: Gain real-time, drillable insights into what drives your business.
- Improve Financial Accuracy: Minimise human error in critical calculations like POC and PIT accounting.
- Increase Team Engagement: Our approach delivers quick wins and reduces change fatigue, ensuring user adoption.
- Empower Your Finance Team: Free up your team from mundane data tasks to focus on high-value strategic analysis.
For Finance, By Finance
We understand financial logic as well as data logic. That’s why our dashboards don’t just look smart, they think like your finance team does!
So, with Datanomy, you don’t have to choose between form and function.
You get a solution that adapts to how you work.
Talk to an expert to see how we can increase visibility for you.