Contact Us
Home
Solutions
Blogs
Client Journey
About Us
Home
Solutions
Blogs
Client Journey
About Us
Datanomy Solutions
Home
Solutions
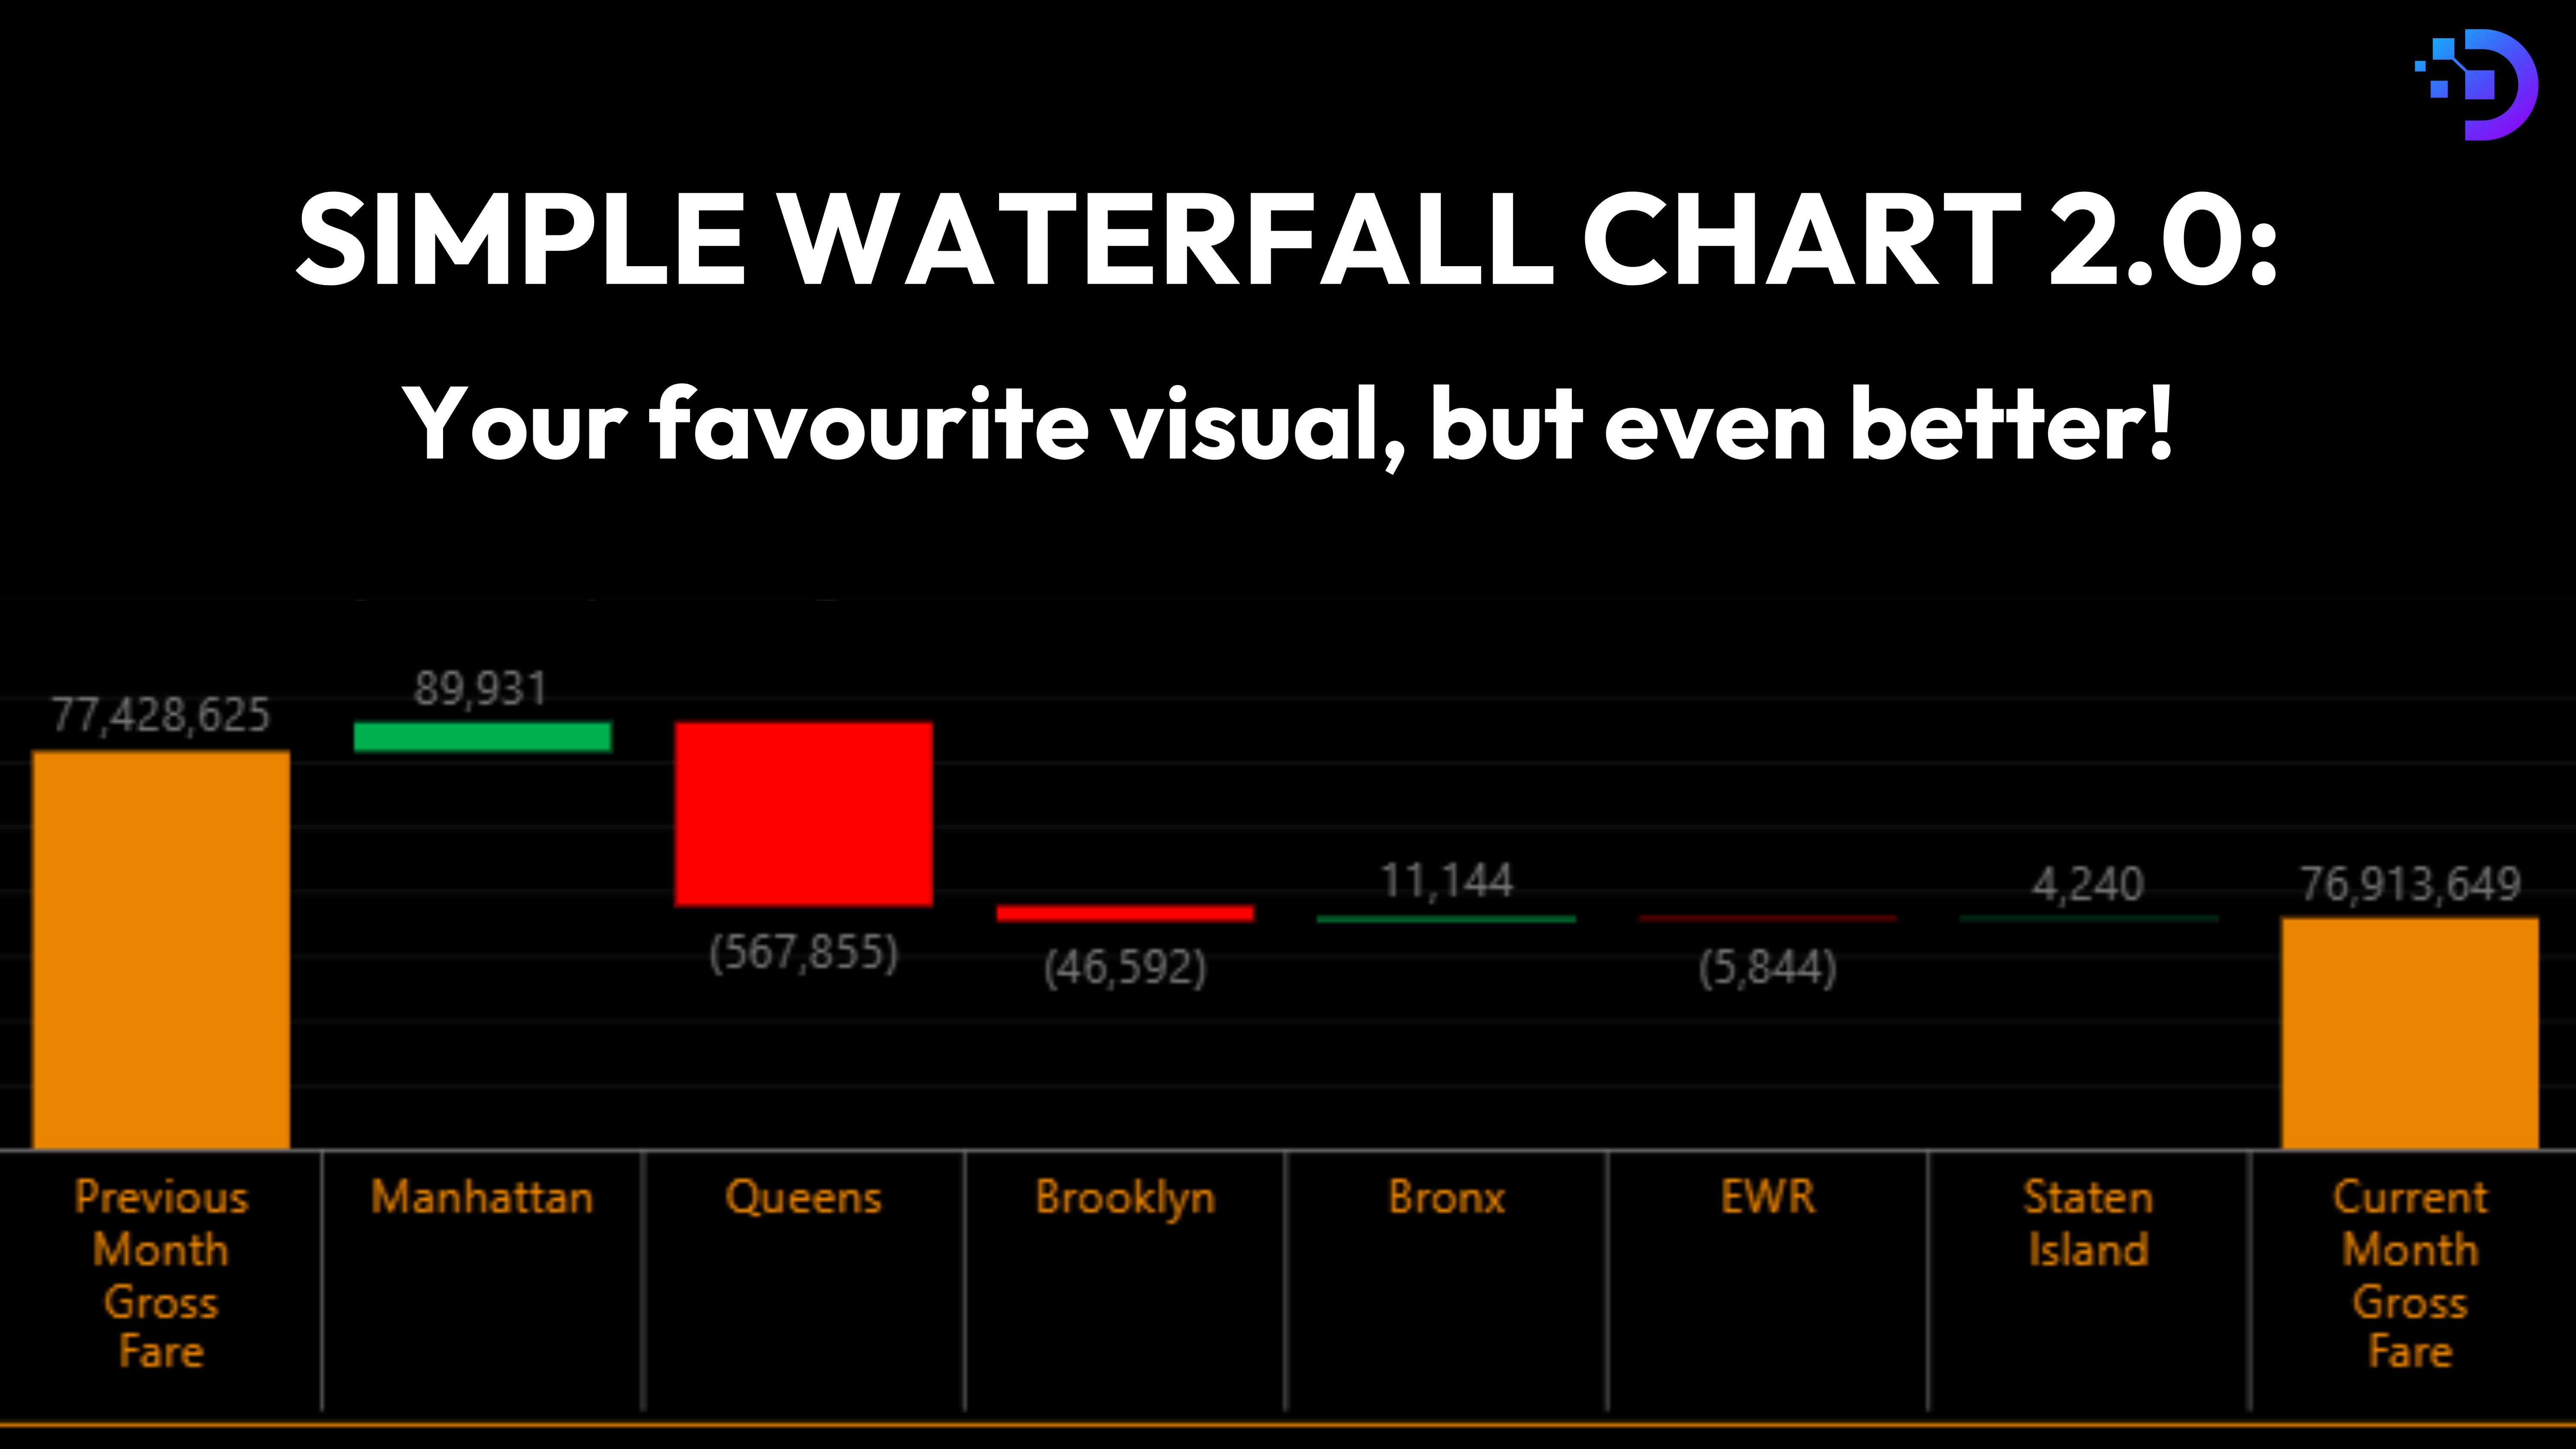
Simple Waterfall Chart: New version & Bug Fixes 2026
Read More
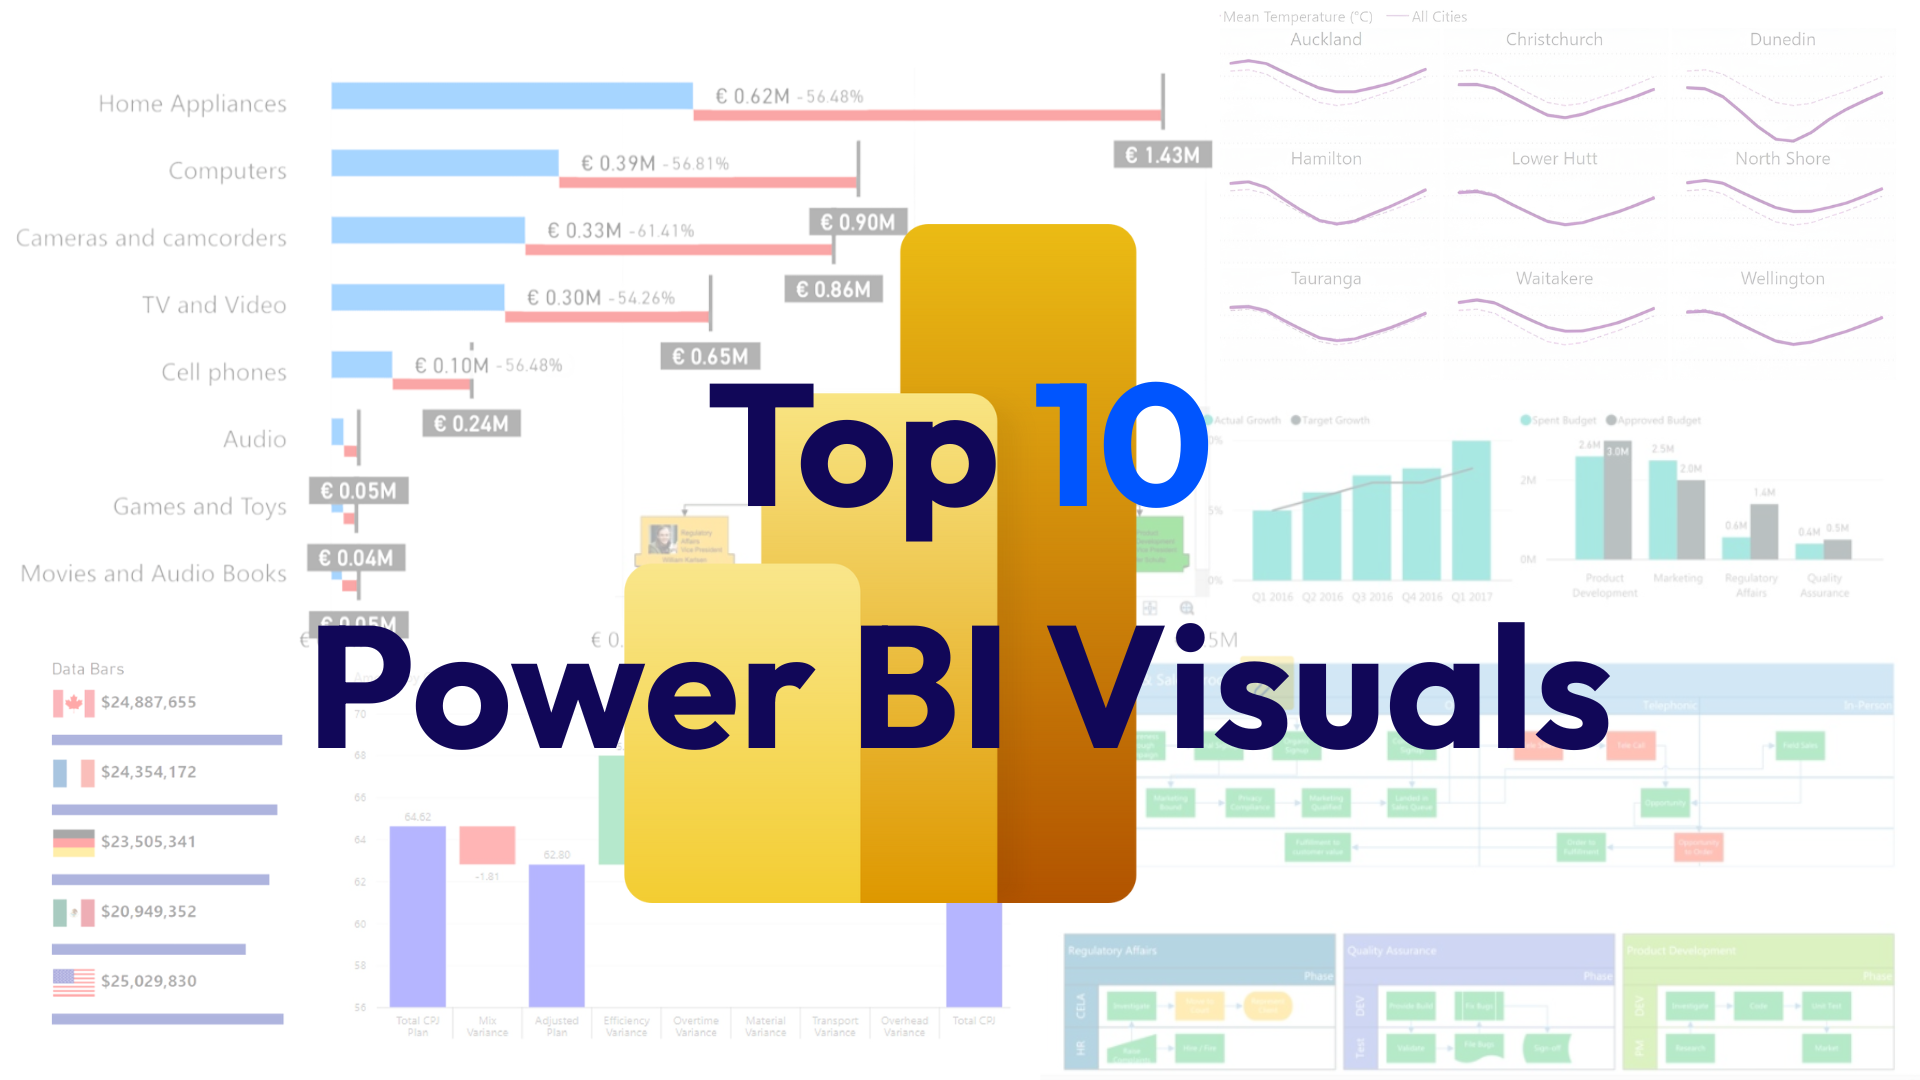
Top 10 Power BI Visuals (2026’s best) With Use Cases & Pro Tips
Read More
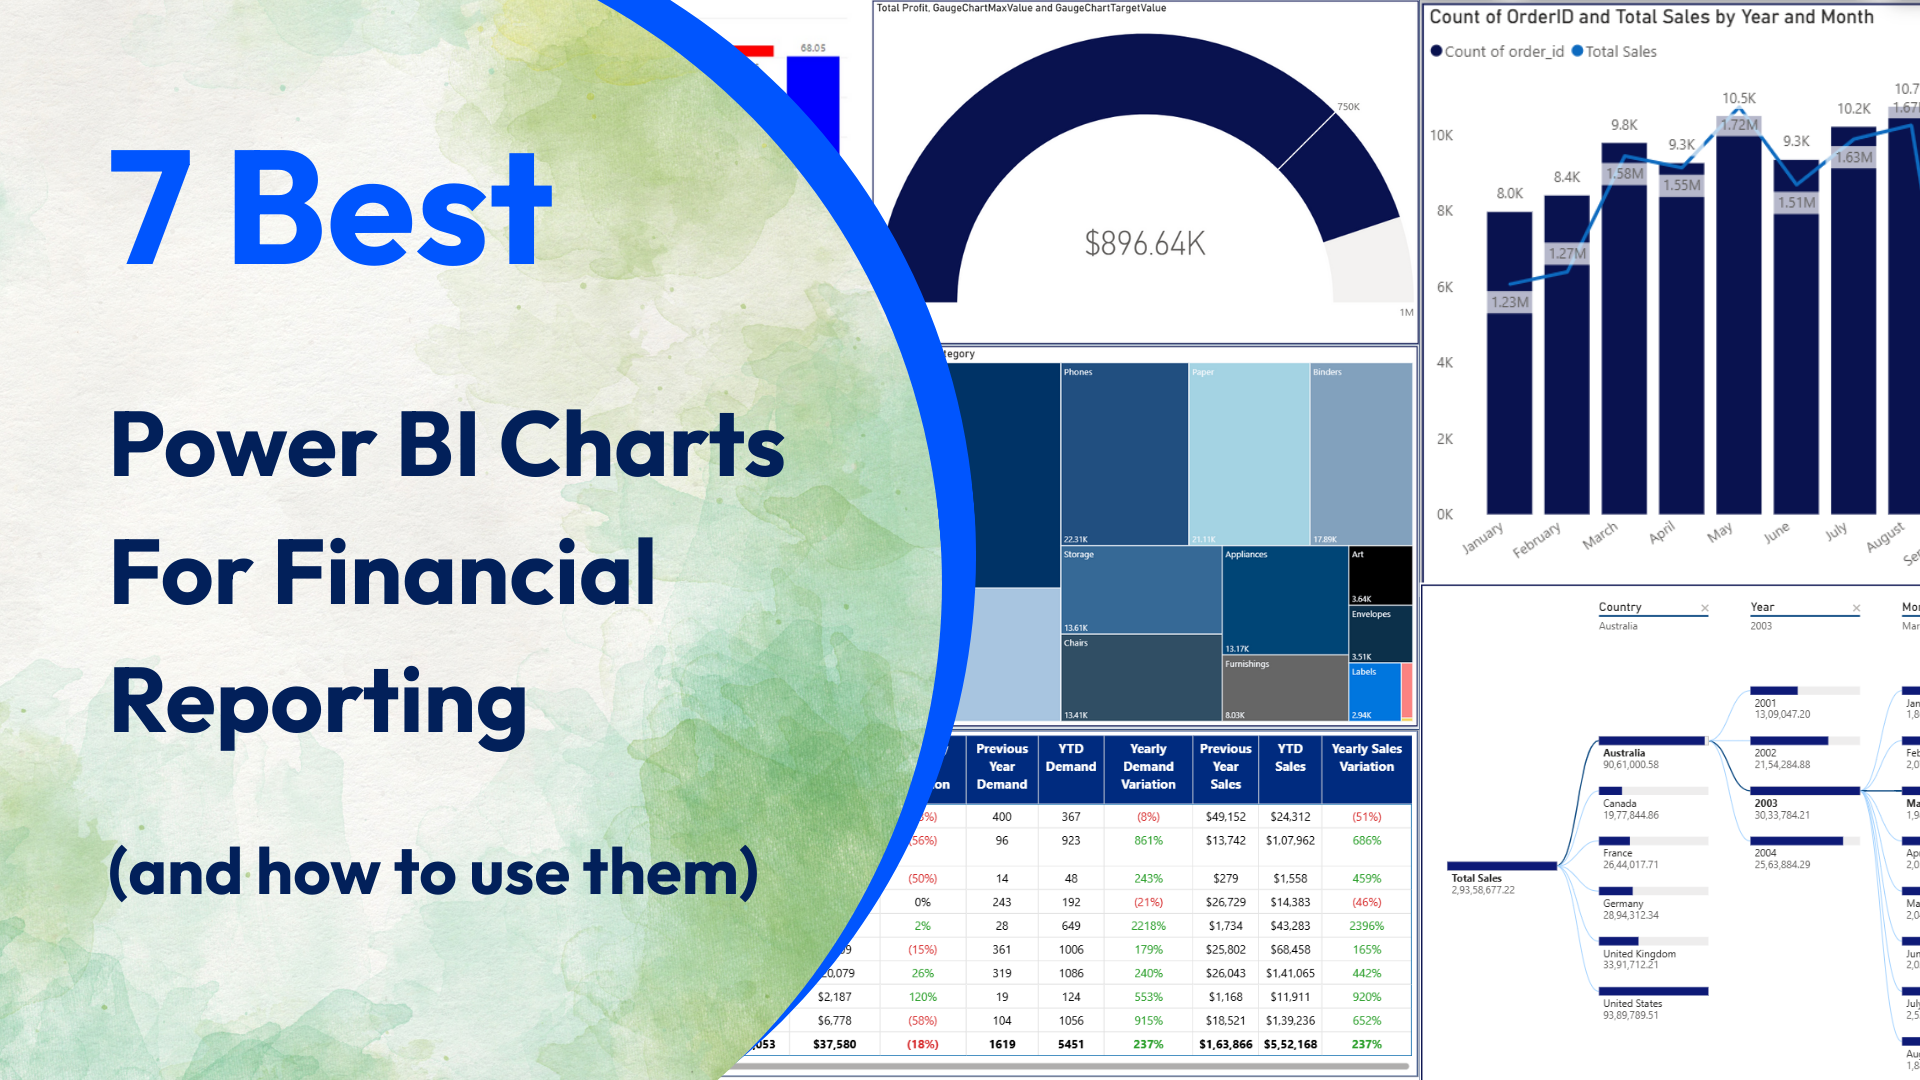
7 Best Power BI Charts For Financial Reporting (and how to use them)
Read More
Page
1
Page
2
Search
Search
Latest Blogs
January 27, 2026
Simple Waterfall Chart: New version & Bug Fixes 2026
January 27, 2026
Top 10 Power BI Visuals (2026’s best) With Use Cases & Pro Tips
September 2, 2025
7 Best Power BI Charts For Financial Reporting (and how to use them)
Home
Solutions
Blogs
Client Journey
About Us
Home
Solutions
Blogs
Client Journey
About Us