There’s always a Power BI visual that is permanent in your dashboards, and finding a bug in this visual can really derail your reports, but if that visual is Simple Waterfall chart by Datanomy Technologies, you’re in luck!
In this blog, we’re diving into a temporary workarounds for the bugs you might be facing, going over the functionalities from the older version, and—drumroll, please—unpacking the new improvements that the latest version brings to the table.
So, buckle up! Whether you’re a fan of the ‘good old version’ or all about embracing the new enhancements, there’s something in this blog for you.
If you want to know more about this highly-rated, customisable and elegant Simple Waterfall PBI Chart, check out our other blog.
How to fix errors: Temporary Workaround
Our team is committed to keep the visual up to date on the Microsoft Appsource, and so, we have updated the Simple Waterfall chart to the latest Microsoft API for Power BI custom visuals. If you encounter any other bugs, issues, or inconsistencies while using Simple Waterfall new version, please do not hesitate to reach out to us—we’re here to help!
Need a quick fix in the meantime? Check out the temporary workaround we’ve outlined below:
Option 1: Organisational Visual- You can add this visual to your organisational visuals.
Option 2: Power BI Visual: You can import the visual directly into Power BI.
Instructions to Import Simple Waterfall Visual from Your Local Computer
a. Enable Developer Options:
- In Power BI Desktop or your report, click on File > Options and Settings > Options.
- In the Options window, go to Report Settings and check the box next to Develop a Visual.
- Click OK to save the settings.
b. Import the Custom Visual:
- Download the zip file from here
- Extract the content of the zip file on your local machine
- Then follow these instructions from Microsoft to import the visual from your local computer: Import Power BI visuals from AppSource or from a file – Power BI | Microsoft Learn
c. Update the Visual:
- Once the custom visual is imported, change the Simple Waterfall visual to any other visual, such as a table.
- Then, click back on the Simple Waterfall visual (from the visuals pane) and it should start working.
- You can also right click on the visual icon and check the version. It should say 2.0.11.4
Note:
If you’ve customised bar colours in the visual, after importing the temporary fixed version, the colors you set might change. To resolve this, simply reapply your desired colors to the bars.
Functionalities in Older Version
a. Drill Through Capability: Users can click on a data point within the chart to drill through to another report or page that provides more detailed information related to that specific data point.
b. Drill Down Capability: Users can click on elements within the chart (e.g., categories or aggregated data points) to drill down and view more detailed information or breakdowns.
c. Visual Interaction:
- Explanation: The visual interaction functionality allows users to interact with one visual element to filter other visuals on the report page.
- Usage: Users can click on any pillar in the waterfall chart, and the other visuals on the report will automatically get filtered based on the clicked data point.
d. Filtering and Slicing:
Usage: Users can apply filters or slicers to a visual to view specific subsets of data based on certain criteria.
Types:
- Basic Filter: Applies a filter to the visual based on a particular field, such as filtering by a specific date range, category, or measure.
- Advanced Filter: Allows users to apply more complex conditions, such as “greater than” or “less than” a specific value, or “top N” filtering.
Functionalities in the updated version
The new version of our Simple Waterfall chart retains all the functionalities of the previous version, but also includes several bug fixes, performance improvements, and new features to enhance your experience.
I. X-Axis Label
Old Version
- Distortion: X-axis labels would get distorted while drilling down, at the lowest data level.
- Word Cutting Off: Labels were sometimes cut off and not fully displayed due to insufficient space.
- Always-On Fit to Width: The Fit to Width option was on – default, which caused label distortion, especially with long labels.
New Version
- The issue of distorted X-axis labels at the lowest data level has been fixed.
- The Fit to Width option is now always off by default. If needed, users can turn it on for auto-adjustment.
- Labels will now display vertically if the width of the chart is too small.
- We can now display long labels as dotted words (ellipses), preventing them from being cut off.
- The Concatenate option to concatenate labels if desired, offering even more flexibility in label handling.
- You can enable or disable the “wrap text” option to improve the clarity and readability of labels in various chart sizes.
II. Orientation Switching Issue
Old Version
Changing the chart orientation between vertical and horizontal caused Y-axis numbers to be cut off, resulting in incomplete visuals.
New Version
This issue has been resolved, and now switching between vertical and horizontal orientations works seamlessly, with Y-axis labels fully displayed and no truncation.
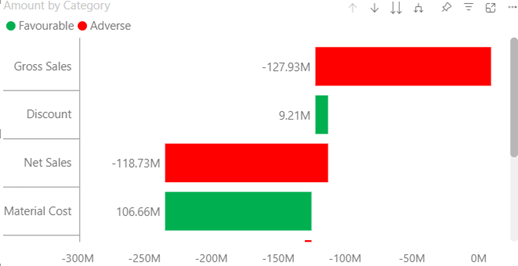
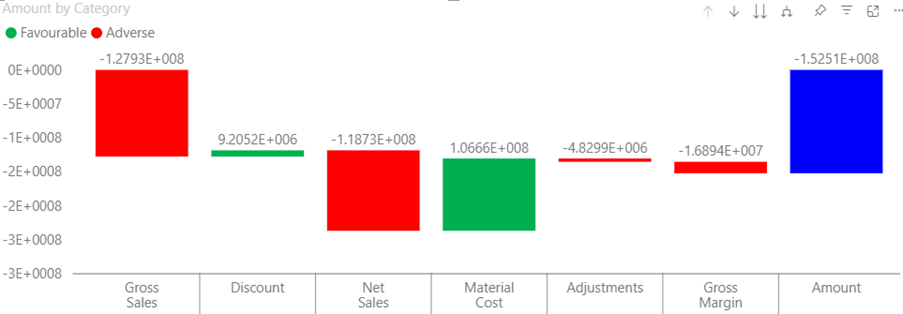
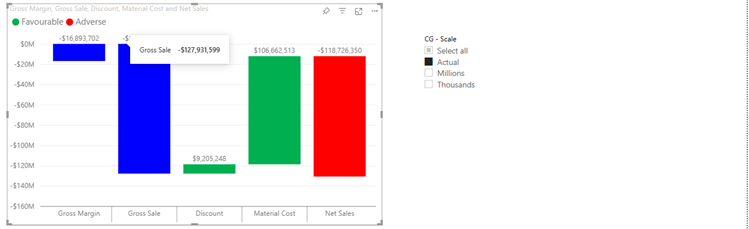
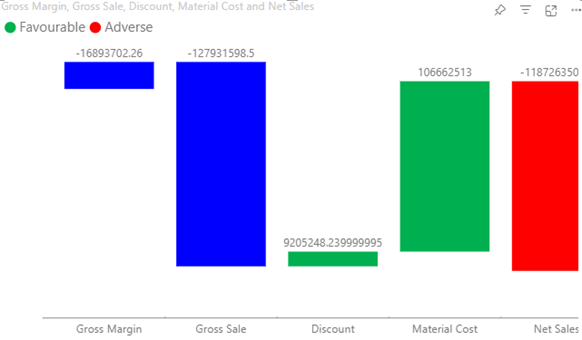
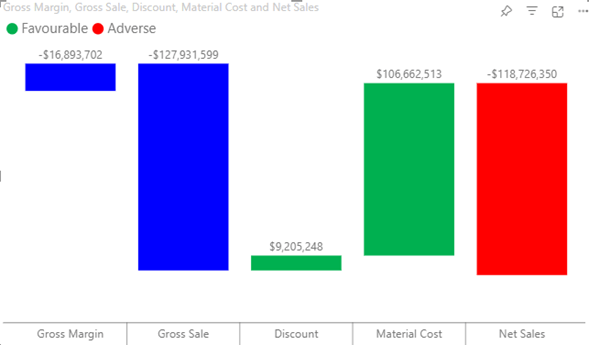
III. Data Format Handling
Old Version
The chart struggled with handling different data formats such as currency, decimals, percentages, and scientific notation. When these formats were applied the data got displayed incorrectly or inconsistently.
New Version
- We now display all data formats correctly according to the set format, including currency, percentages, decimals, and scientific notation. The visual maintains consistency across different formats.
- When the value format in labels is set to “None,” the labels should follow the same format as the measures. However, if the format is set to “Auto,” the labels should not apply any formatting of measures.
IV. Data Label Visibility
- Old Version: Data labels were not always visible, especially in cases where there wasn’t enough space for them, leaving some labels hidden or not rendered.
- New Version: We have resolved this issue, ensuring that all data labels are now visible, even in compact spaces, and adjust properly based on the available chart size.
V. Focus Mode Issue
- Old Version: When entering Focus Mode, the visual would sometimes go blank, rendering it unviewable or unusable.
- New Version: We have fixed the issue of the visual going blank in Focus Mode, ensuring the chart remains visible and interactive when zoomed in.

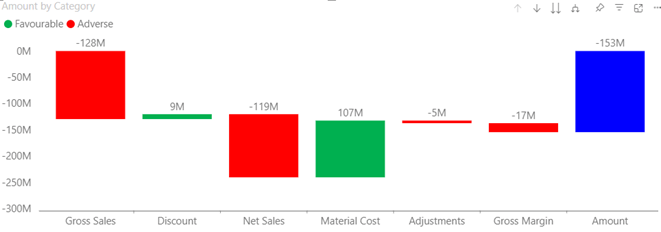
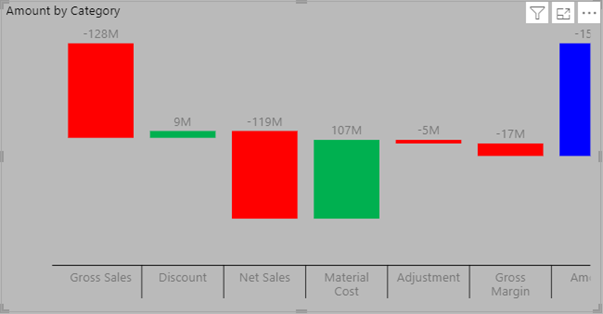
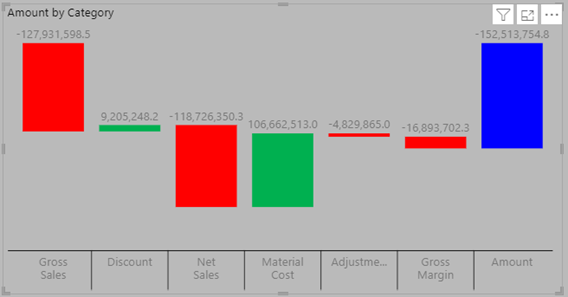
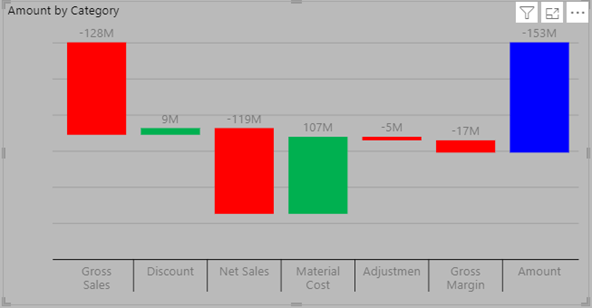
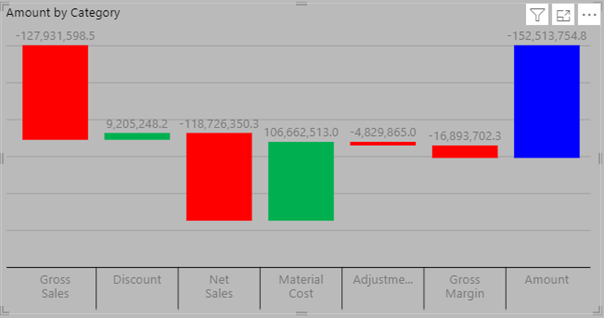
VI. Number Formatting
Old Version
Previously, when the value format in labels was set to “none,” number formatting such as #,##0; (#,###) was not applied correctly, causing numbers to display without proper formatting.

New Version
We have resolved the number formatting issue. Values now display correctly according to the chosen formatting options, including commas, parentheses for negative values, and decimals.

VII. Calculation Group Compatibility
Old Version
The Simple Waterfall chart had a formatting incompatibility with calculation groups. Previously, formatting a calculation item did not display the data according to the applied format, causing inconsistent presentation.

New Version
We have fixed this incompatibility. Now, when you format a calculation item, the data displays correctly according to the applied format, ensuring consistent visual output.
VIII. Y-Axis Disabling Issue
Old Version
Disabling the Y-axis left a large, empty space that disrupted the alignment and appearance of the chart.
New Version
We have resolved the large blank space issue. Disabling the Y-axis no longer leaves an empty area, improving chart alignment and visual integrity.
IX. Chart Misalignment with Y-Axis Disabled
Old Version
Turning off the Y-axis caused the entire chart to shift to the right, misaligning the data and visual layout.
New Version
This issue has been fixed, and turning off the Y-axis no longer causes the chart to misalign. The layout remains stable, even without the Y-axis.
X. “Fit to Width” and “Bar Width” Options
- Old Version: These options did not work properly for horizontal chart orientation. They were either ignored or caused issues with the display.
- New Version: The “Fit to Width” and “Bar Width” options now function correctly for horizontal chart orientation, ensuring that the chart adjusts as intended without any display issues.
XI. Hidden Y-Axis Misalignment
Old Version
When the Y-axis values were hidden using the “Show/Hide Values” option, the chart did not adjust its position accordingly. This caused misalignment, with empty spaces on the left side of the chart.
New Version
This issue has been fixed. When Y-axis values are hidden, the chart properly shifts to the left to account for the space previously occupied by the Y-axis, ensuring clean and aligned visuals.
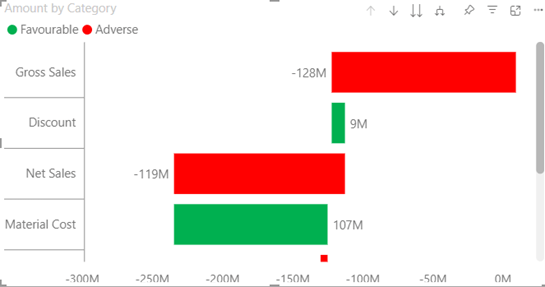
XII. Label Visibility in Horizontal Orientation
- Old Version: In horizontal orientation, some bars would not display their labels properly, leading to missing or incomplete data labels in the chart.
- New Version: This issue has been resolved, and labels are now displayed correctly, even in horizontal orientation, ensuring that no labels are missed or hidden.
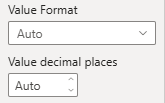
XIII. Missing “Auto” Option for Decimal Places
Old Version
The absence of an “auto” option for decimal places in value label formatting caused issues in formatting, especially when different data ranges were used.
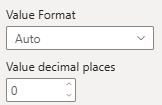
New Version
The “auto” option for decimal places has been added back, allowing for automatic adjustment of decimal places based on data range, improving consistency and readability.
Wrapping it up…
Bugs and new version upgrades are all part of the tech journey. While this temporary workaround can save the day, we hope that understanding the strengths of the new version will help you make the most out of the Simple Waterfall Visual!
Embrace the changes, learn from the glitches, and let those new features elevate your workflow.
Moreover, we had updated the simple waterfall chart to the latest Microsoft API for Power BI custom visuals as part of our commitment to keep the visual up to date on the Microsoft Appsource. Meet the amazing team behind this visual!
Please feel free to reach out to us if you encounter any other bugs, issues, or inconsistencies while using the visual or simply to give your feedback. We’re always glad to hear from you.
After all, it’s not just about fixing what’s broken, it’s about growing with every update.