Simple Waterfall Chart: New version & Bug Fixes 2026
There’s always a Power BI visual that is permanent in your dashboards, and finding a bug in this visual can really derail your reports, but if that visual is Simple Waterfall chart by Datanomy Technologies, you’re in luck! In this blog, we’re diving into a temporary workarounds for the bugs you might be facing, […]
Read More
Top 10 Power BI Visuals (2026’s best) With Use Cases & Pro Tips
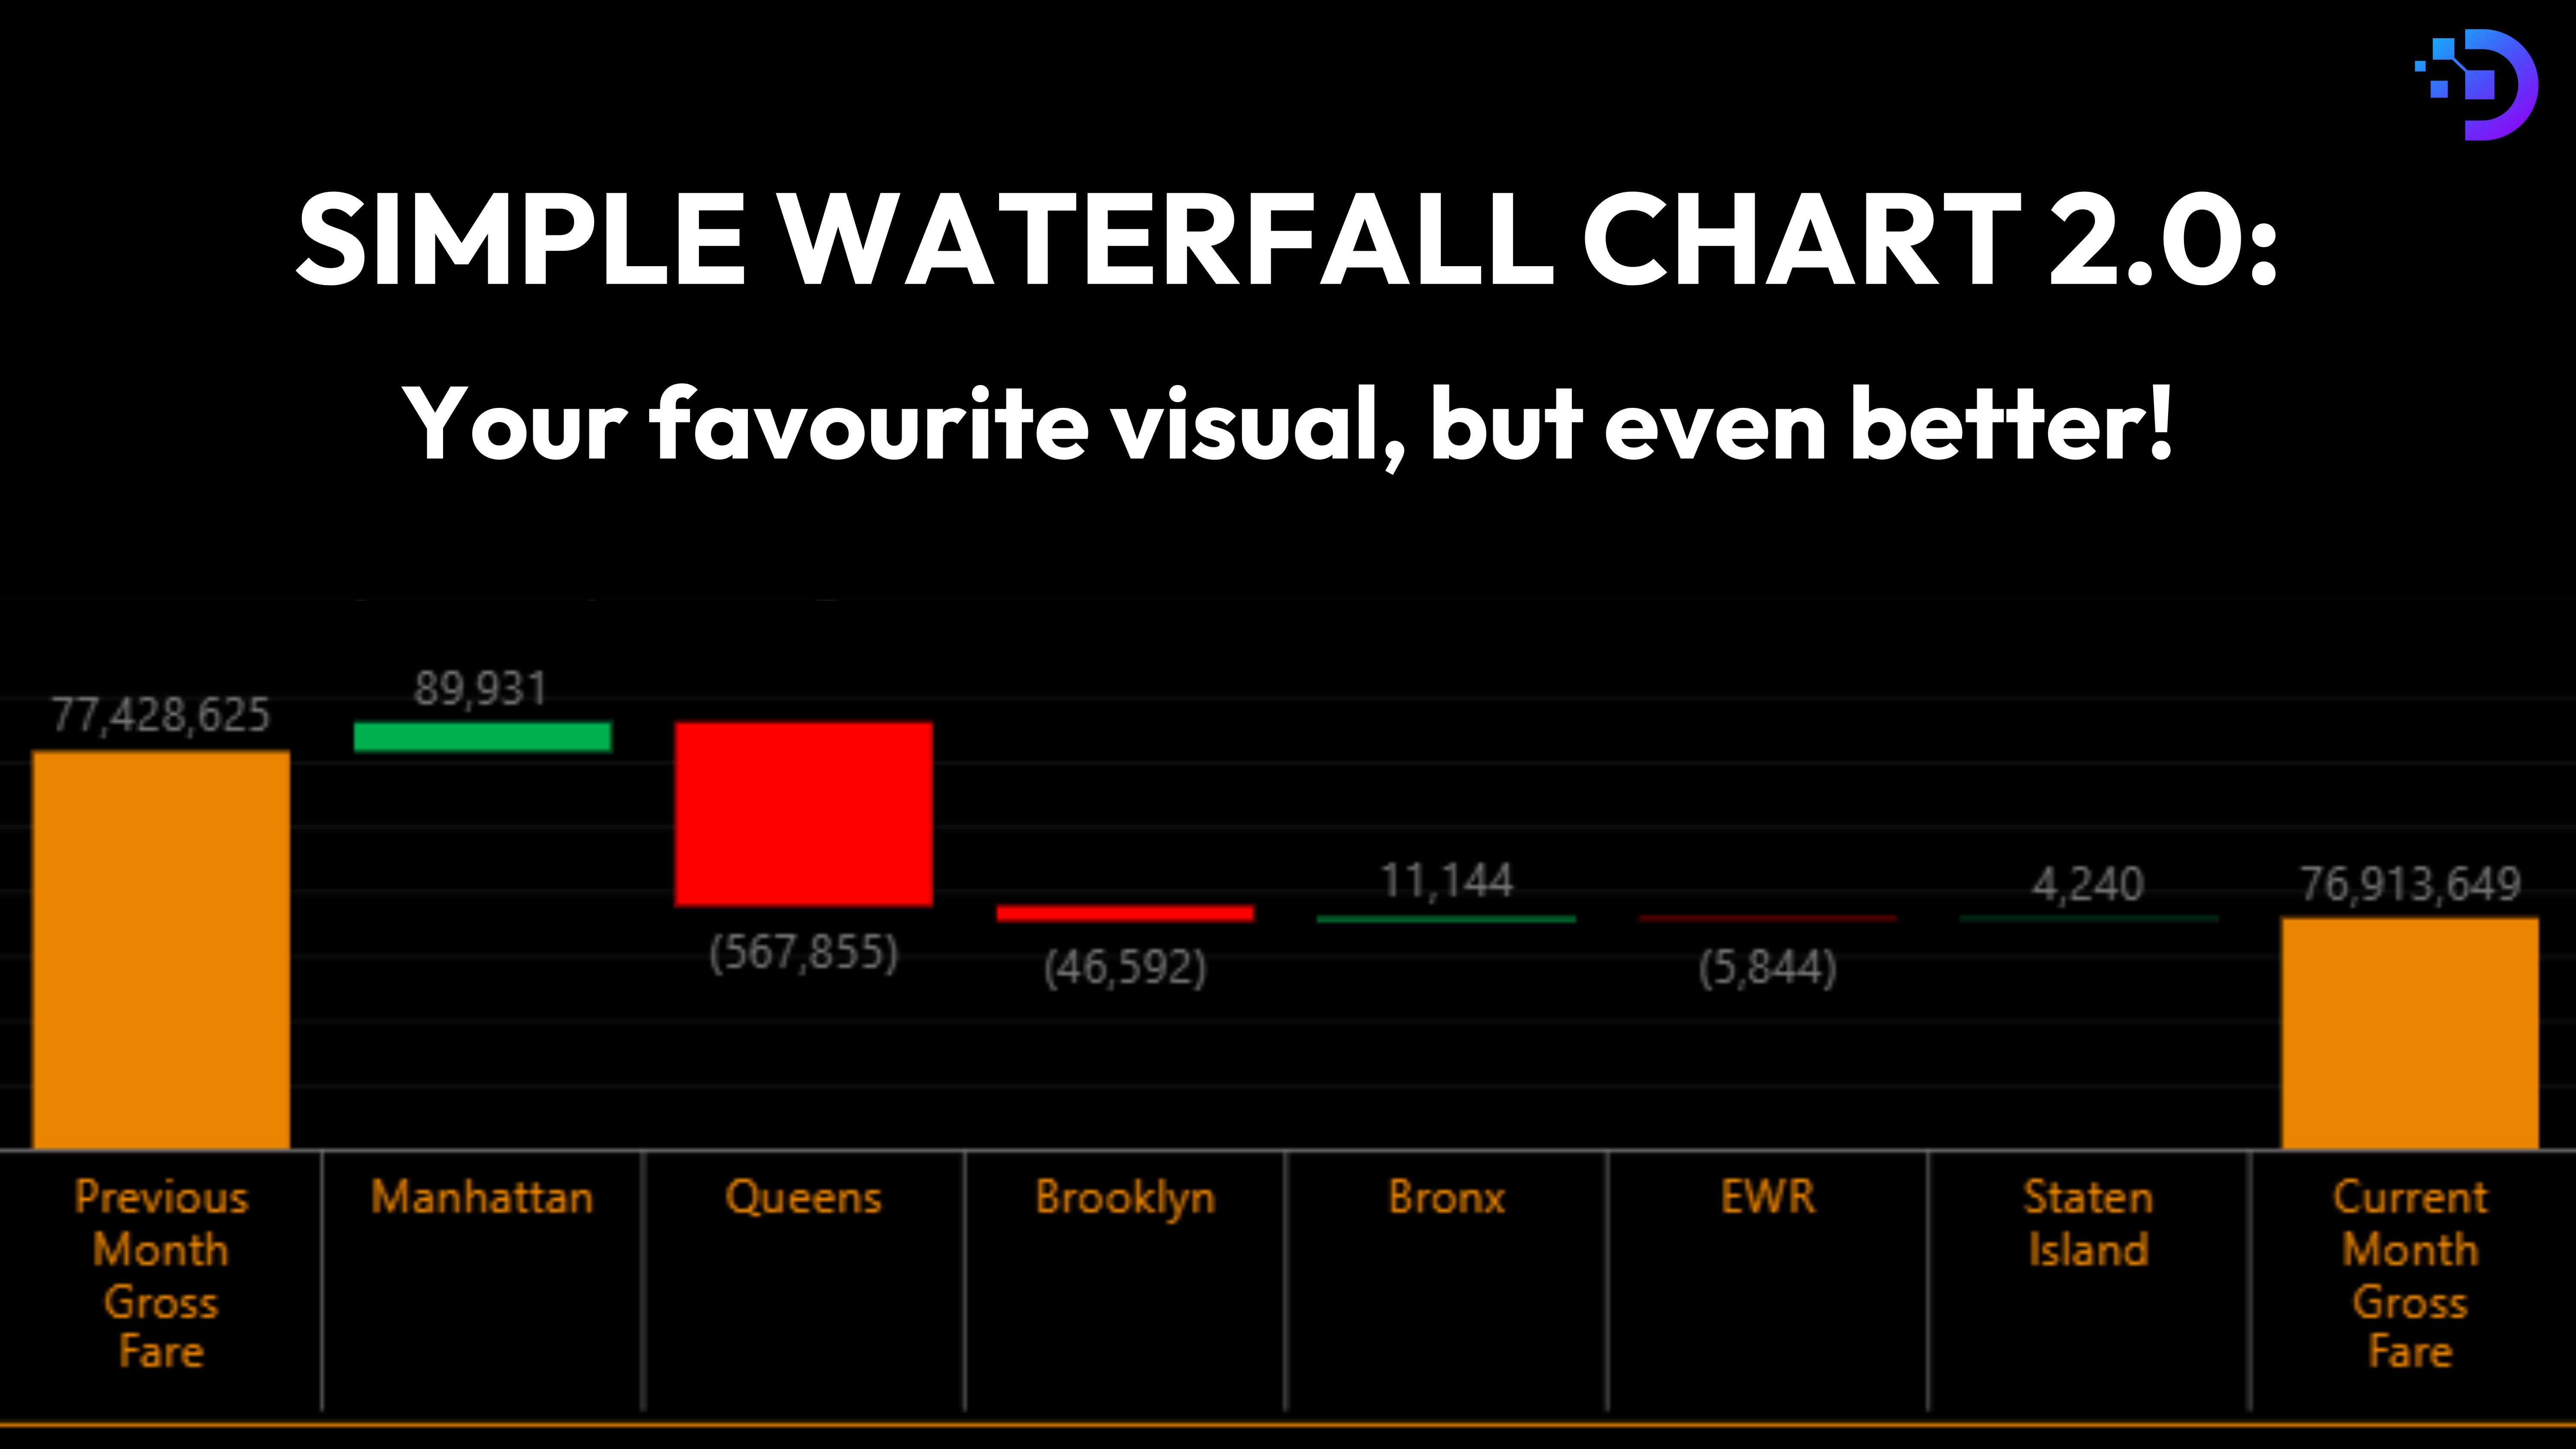
Datanomy’s highly-rated, Power BI ‘Simple Waterfall‘ chart is a fantastic tool for visualising how an initial value evolves through a series of positive and negative changes.
Read More