Day: April 4, 2025

Simple Waterfall PBI Visual- All you need to know

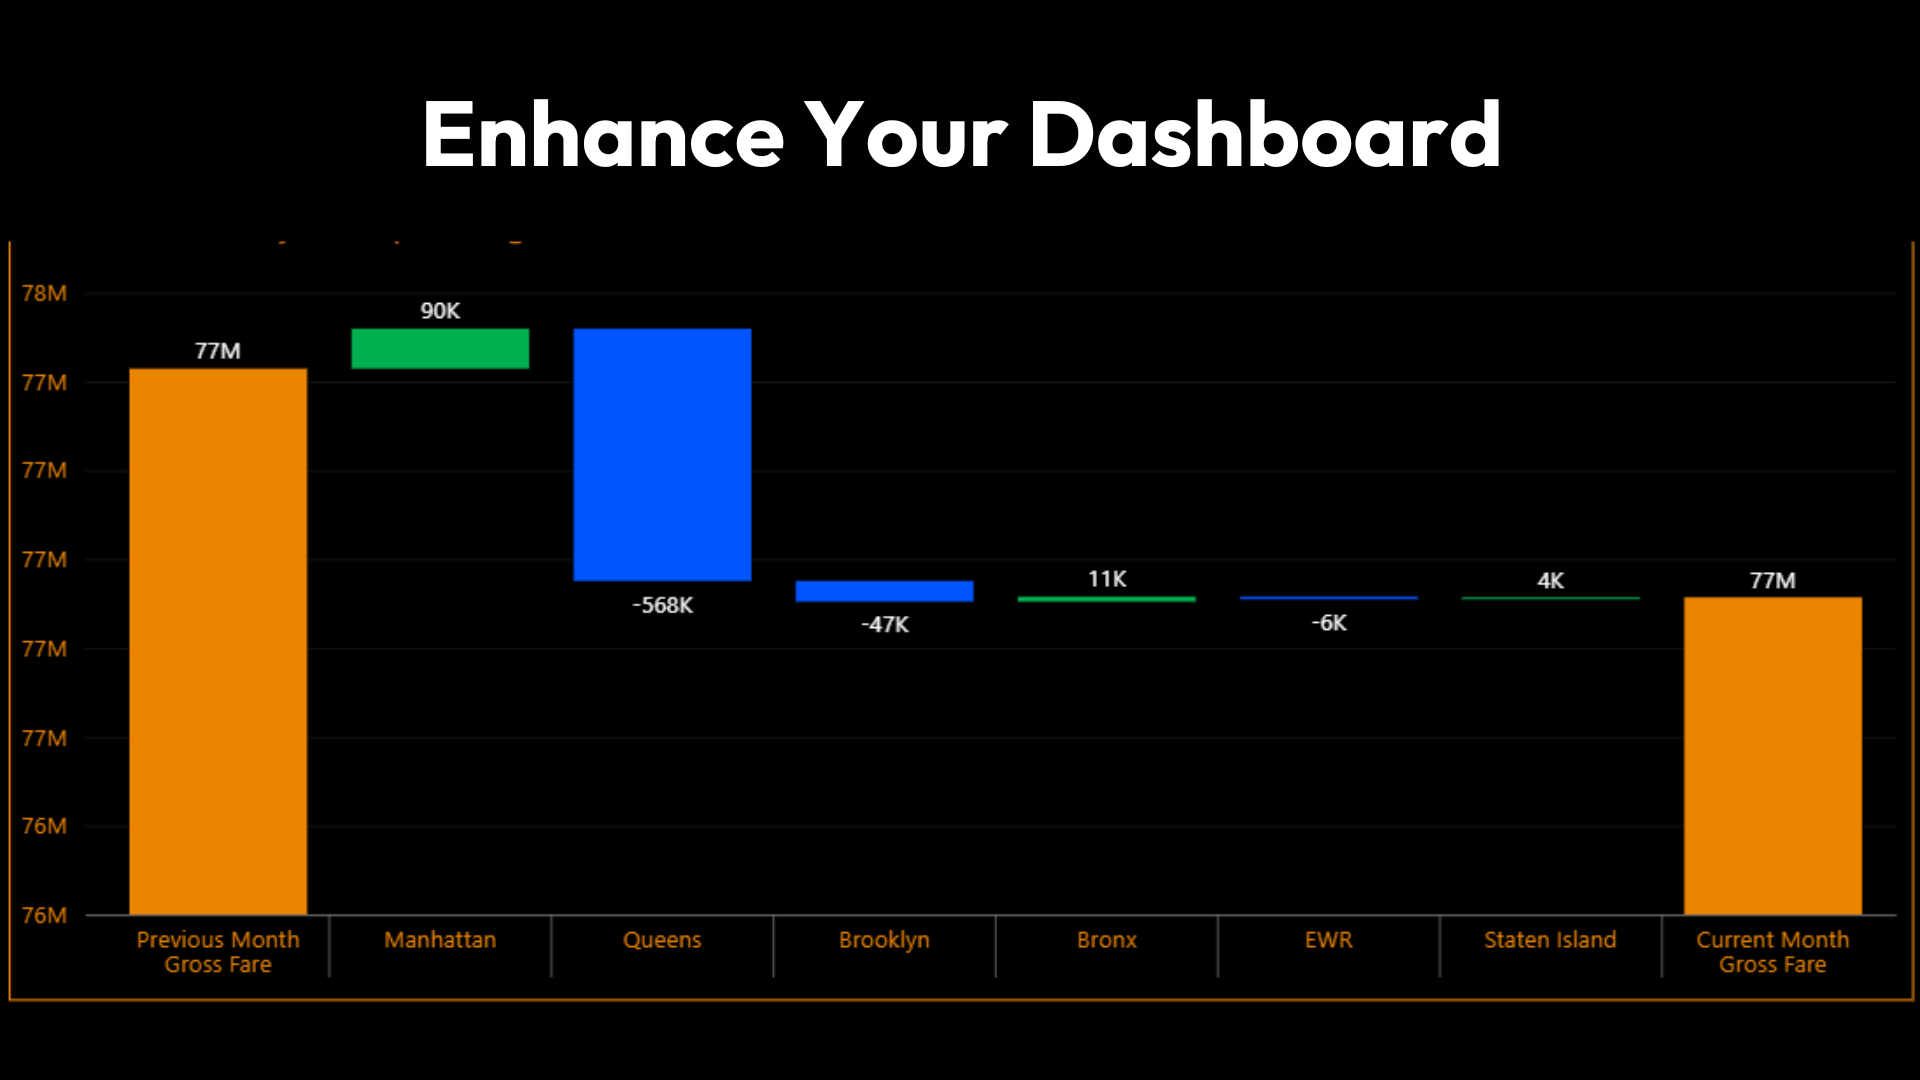
Datanomy’s highly-rated, Power BI ‘Simple Waterfall‘ chart is a fantastic tool for visualising how an initial value evolves through a series of positive and negative changes.

Read More

Simple Waterfall Chart: New version & Bug Fixes

  There’s always a Power BI visual that is permanent in your dashboards, and finding a bug in this visual can really derail your reports, but if that visual is Simple Waterfall chart by Datanomy Technologies, you’re in luck! In this blog, we’re diving into a temporary workarounds for the bugs you might be facing, […]

Read More
Please include your country code
How can we help?
What stage is your project currently at?
How quickly do you want your project to be delivered?
How did you hear about us?
Would you like to sign up for email updates?